For decades, musicians and educators have treated perfect pitch as some mysterious, all-or-nothing gift. Most people implicitly set a threshold for "perfect pitch," drawing an invisible line where anyone above it "has" perfect pitch, while anyone below it does not. People don't agree on the threshold, and the binary view obfuscates the full continuum of ability levels. With all these different definitions and levels, it's not surprising that aggregated data from 160 historical perfect pitch studies demonstrated pitch recognition ability to be a sliding scale rather than a binary trait. Treating it as binary not only ignores the complete spectrum of skill levels, but also implies there is no learning process, no progression to measure, and nothing meaningful to track.

The most common threshold for perfect pitch seems to be something like the ability to recognize all 12 pitches in the Western scale without thought or effort, happening quickly, seemingly instantly, and automatically. It's often equated to seeing color: if you see in color, you don't have to think about identifying colors, the color is the color you see. The self-referencing definition makes it surprisingly difficult to explain something as mundane as identifying colors with words. This, in turn, reinforces the binary narrative by implying that you either have perfect pitch or you do not, much like being color-sighted versus colorblind. Measuring perfect pitch with a simple correct/incorrect scorecard also strengthens the binary narrative. Either you name the note correctly, or your answer is lumped in as an incorrect "guess". This binary framing directly contradicts data from real learners, which shows clear gradations of progress.
What Precision Looks Like in Real Learners
Observing real learners develop perfect pitch with HarmoniQ, I've learned that progress can be measured by tracking the distance from the correct answer. For example, a learner will be able to confidently and consistently tell you G♯ isn't D long before they can reliably tell D from C♯. This kind of progress is invisible to scoring that weighs all incorrect responses the same, and aggregated data from HarmoniQ demonstrates user precision steadily improving until learners can reliably identify all 12 notes. As learners advance through tritone, major third, minor third, whole step, and semitone lessons, their mistakes consistently move closer to the correct pitch. Even when raw accuracy scores start low, the distance of mistakes shrinks in a predictable pattern that shows real progress.
When someone takes a full 12-note test without the right foundation, the mismatch between the evaluation and their skill level can make responses appear completely random. An "all-notes" test scored as pass/fail flattens early stages of learning into apparent failure, when those early steps are where measurable progress actually begins. By contrast, data from millions of HarmoniQ trials shows mistakes clustering closer to the target pitch as learners move through lessons with progressively smaller intervals. This progression emerges because advancing to tighter intervals requires reaching proficiency at the broader ones. In practice, learners arrive at more advanced lessons only after building the necessary foundation, which makes mistake patterns meaningful indicators of progress. The earliest lessons, tritones and thirds, are meant to train chroma recognition and don't add much statistical variety as there's only one possible interval error. Once learners unlock finer distinctions, mistake patterns begin to reveal measurable distributions:
- Minor Thirds: Close to 90% of mistakes fall within a minor third.
- Whole Steps: Over 85% of mistakes fall within a whole step.
- Semitones: About 75% of mistakes are a semitone away. A random spread would be merely 9% per possible mistake (1/11), or ~18% one semitone away from the target pitch.
Even when initial raw accuracy is low, the distance of mistakes shrinks dramatically as training progresses. Precision, not just correctness, shows the unmistakable trajectory of learning. With consistent practice over months, many learners have progressed through these stages to reliably identify all 12 notes with more than 95% accuracy, eventually crossing the threshold that most people consider "perfect pitch."
Why Conventional Scoring Falls Short
Consider a learner who has reached the level of ±1 semitone, which is already near the threshold most people call perfect pitch. This means they always answer within a half step of the correct note. If their responses are evenly distributed, which is not uncommon at first, about one third will be exact matches and two thirds will be a semitone away. Conventional scoring would report this as 33% accuracy. On paper that might look like noise, easily dismissed as chance. In fact, a 1993 study that defined perfect pitch in binary terms classified "not perfect pitch" as anything scoring between 10% and 40% accuracy. By that standard, a learner who is consistently within a semitone of every note in the scale is labeled simply as "not perfect pitch," even though they are on the cusp of mastery.
This binary approach hides nearly the entire learning process. Scores creep from random up to 33%, giving no indication of how close a learner is to mastery. As the learner continues to improve, their score suddenly jumps to 100% once the exact notes fall into place. The long path of steady improvement is collapsed into a flat line followed by an abrupt spike, reinforcing the illusion that perfect pitch is all-or-nothing rather than a skill developed in measurable stages.
How HarmoniQ Scores Your Journey
HarmoniQ doesn't just give learners a pass/fail percentage. It tracks your precision for each individual pitch in a radar chart and then combines those scores into an overall proficiency. Each incorrect response is implicitly weighted by its distance from the target pitch, larger intervals are reviewed with spaced repetition, and focused practice at smaller intervals helps improve your precision.
- ~36%: precision is closer than a tritone
- ~46%: precision narrows to a major third
- ~57%: precision narrows to a minor third
- ~72%: precision clusters within a whole step
- ~90%: precision clusters to ±1 semitone
- 90–100%: precision better than a semitone, building mastery
HarmoniQ doesn't explicitly train microtonal distinctions, but mathematically, accuracy above 95% implies precision better than ±½ semitone. Instead of a flat score showing virtually no progress, the radar chart shows measurable progress along the sliding scale of pitch precision.
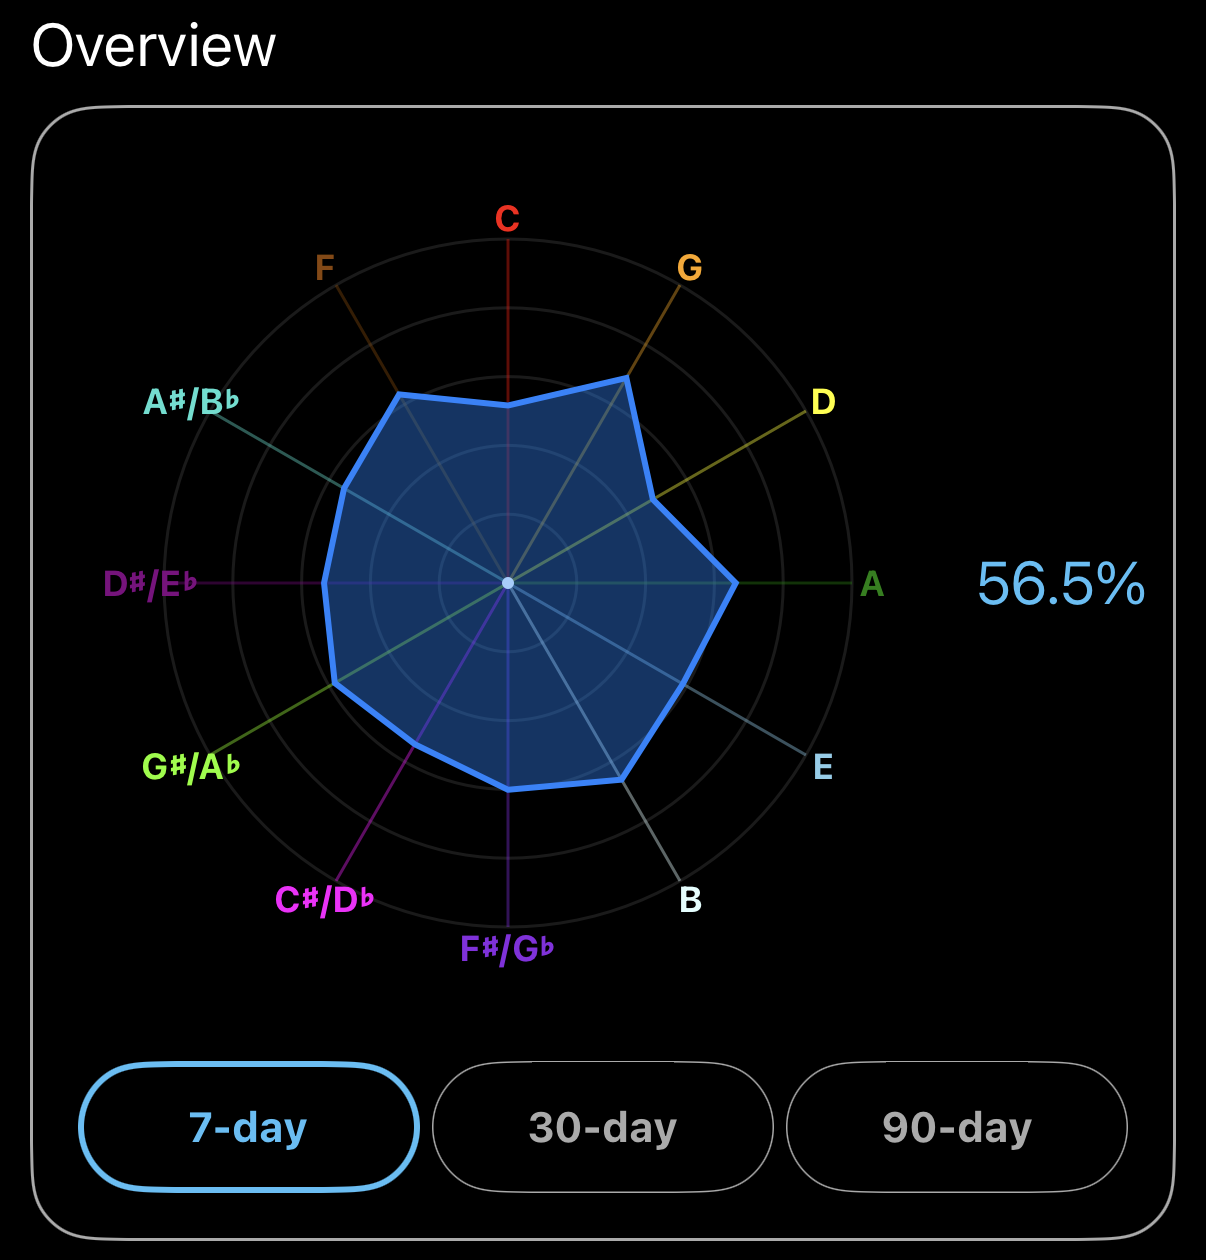
The data makes it clear that perfect pitch is not a fixed binary trait. Definitions and thresholds continue to shift, and you can join other learners and slide along the scale by training your ear. HarmoniQ's scoring captures your progress rather than forcing you into a pass/fail box. By combining accuracy with distance, the radar chart shows not just whether you're "right" or "wrong," but how far you've come and how close you are to that effortless, color-like mastery of pitch recognition.